In today’s rapidly advancing world of precision agriculture, integrating cutting-edge GPS technology is key to boosting productivity and maximizing efficiency on the farm. Trimble, a leader in agricultural innovation, offers a range of GPS systems designed to meet various farming needs. This guide compares three popular models—GFX-350, GFX-1060, and GFX-1260—so you can choose the best option for your operation.
Precision Agriculture and GPS: The Foundation of Modern Farming
Precision agriculture uses technology to monitor and respond to variations in crops, soils, and environmental conditions. GPS systems are at the heart of this process, allowing farmers to apply seeds, fertiliser, and chemicals more efficiently. The result? Optimised yields, reduced waste, and improved sustainability.
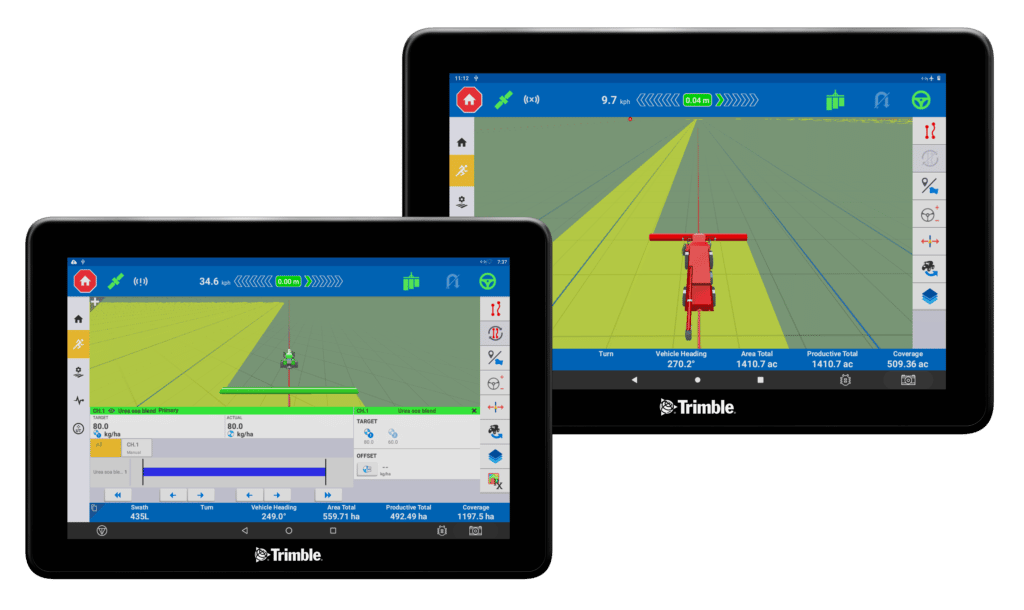
Trimble’s GPS solutions offer precise guidance, automated steering, and seamless data integration, empowering farmers to enhance their operations. Let’s explore how the GFX-350, GFX-1060, and GFX-1260 can benefit your farm.
Trimble GFX-350: Simple, Compact and Cost-Effective
Overview:
The GFX-350 is Trimble’s entry-level GPS system, perfect for smaller farms or those beginning their precision agriculture journey. It delivers essential functionality at an affordable price point.
Key Features:
- 7-inch Touchscreen: Compact, easy-to-use display ideal for tight spaces.
- Budget-Friendly: Offers core GPS capabilities without breaking the bank.
- Simple Installation: Quick setup ensures minimal downtime.
- Wireless Connectivity: Equipped with Bluetooth and Wi-Fi for effortless data sharing and updates.
- Upgradeable: Supports ISOBUS, Field-IQ, multi-constellation, autosteer, and full wireless proof-of-placement with Trimble Ag Software.
Best Suited For:
Smaller farms or those looking for a cost-effective, entry-level precision agriculture solution.
Trimble GFX-1060: Versatility for Medium to Large Farms
Overview:
The GFX-1060 brings more power and flexibility, ideal for medium to large farms. Its expanded capabilities support more complex farming activities, making it a versatile tool for diverse operations.
Key Features:
- 10.1-inch High-Resolution Display: Larger screen offers better visibility for field maps and data.
- Faster Processing: Capable of handling complex tasks like variable rate application and section control.
- ISOBUS Compatibility: Integrates with a wider range of equipment, including advanced implements.
- Future-Ready: Supports ISOBUS, Field-IQ, multi-constellation, autosteer, full wireless proof-of-placement with Trimble Ag Software & TeamViewer Remote Support.
Best Suited For:
Medium to large farms that require a more robust system to handle a wider range of agricultural tasks with the added benefit of full upgrade flexibility when you want it
Trimble GFX-1260: Peak Performance for Large-Scale Operations
Overview:
The GFX-1260 is Trimble’s most advanced GPS system, designed for the most demanding large-scale farms. Its high performance and comprehensive features make it the ultimate tool for maximising productivity.
Key Features:
- 12.1-inch Ultra-Clear Display: The largest screen in the series provides unparalleled clarity for detailed field management.
- Powerful Processor: Capable of handling the heaviest workloads without compromising on speed or efficiency.
- Full Precision Farming Suite: Supports the entire range of Trimble’s precision ag tools, from guidance to steering and data management.
- Maximised Efficiency: Control up to 6 input channels and 255 sections to really save on inputs and overlap & give you the ultimate flexibility.
- Advanced Connectivity: Includes Wi-Fi, Bluetooth, ISOBUS and CAN for seamless integration with farm management systems.
Best Suited For:
Large-scale farms or contractors that need top-tier performance and comprehensive functionality, or users that need more screen real-estate for different tasks.
Choosing the Right GPS System for Your Farm
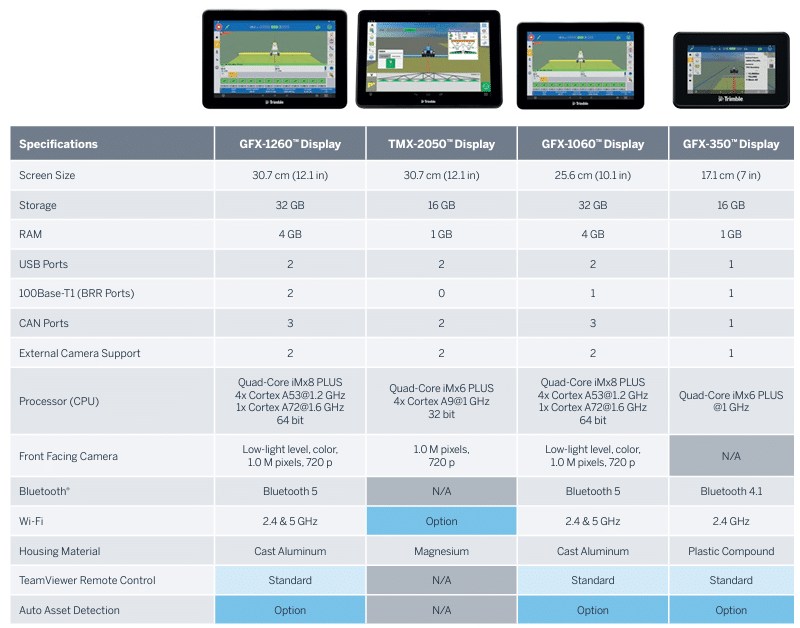
Selecting the right Trimble GPS system depends on your farm’s size, needs, and operational complexity. Here’s a quick comparison to help you decide:
Get Expert Guidance from Vantage NZ
At Vantage New Zealand, our team is dedicated to helping you find the best precision agriculture tools to optimise your farm’s performance. Whether you’re unsure which system is right for you or need expert advice on how to get the most from your GPS technology, we’re here to help. Give us a call—we’d love to chat about how Trimble’s solutions can enhance your farming operation.
Find out more at https://www.vantage-nz.com/displays/
Want to run through step by step what solution best suits your farm? Use Trimble FAST to run through a series of 10 questions to get a tailored recommendation for your requirements. https://ag.trimble.com/fastapp-1