Soil affects everything in agriculture – from seed to irrigation, fertiliser and herbicide use, to the ultimate goal of food and fibre growth. One thing we know about soil is that it’s variable – it changes from one point of your property to the next. That means knowing your soil’s unique properties across the farm is key to effectively managing your inputs and maximising profitability.
With harvest just around the corner, it’s important to have one eye on the future planning your success. In an arable farming system, this is a key time of year to maximise capturing every last grain that contributes to yield and annual performance. It’s what you strive all year for, one decision after another – to grow the best crops and maximise your performance and profitability. A crucial component of good planning is capturing your yield data so that you can track and optimise your farm’s performance. As always, there’s plenty going on in farming and with Christmas and New Year tied up with the time most arable farmers start, it’s easy to feel rushed and drop some of the important aspects of harvest setup and success.
Here are three key steps to ensure harvest success and maximise your yield data.
Before harvest – make sure your combine is serviced, your displays/screens are working (and tested), your wiring looms are installed in your combine (if you’re planning on swapping GPS from one machine to another) and that last season’s yield data on your data card, memory stick or display is downloaded and saved (preferably with a backup) safely for future use. This is also an important time to set up your display with the correct paddock and crop names so that when it comes time to pull that header into the paddock, it’s good to go.
During harvest – when you pull into the first paddock on day one, try to take your time. Make sure everything is set up and working correctly (GPS, moisture meters, flow meters) and that you perform some yield calibrations to get the data recorded as accurately as possible. There’s no need to get too hung up on this if final paddock weights will be available for post-processing yield data, but it’s important to make sure you will end up with accurate data to give you good insights on your yield performance. After the first paddock, we also suggest downloading and checking that the data is recording and mapping correctly.
After harvest – Engage with your precision ag consultants to get the data processed as fast as possible. This ensures you maximise your decision-making time and can use your data to guide decisions for the upcoming season – eg variable rate nutrient replacement and/or variable rate seeding. This data is gold and the more years of yield data put together, the more you identify opportunities to tweak your management practices to optimise profitability across all areas of your paddock or farm.
Vantage New Zealand are your local precision ag experts, with reps located throughout New Zealand. To find out more about how we can help you maximise your yield data, call 0800 482 682 or visit https://www.vantage-nz.com/yield-mapping/
Season and multi-season discounts available when you book before 31st December, 2022.
Just last month, Trimble announced significant improvements to its CenterPoint® RTX correction service, giving farmers the best of both worlds -the ease of use of the satellite-delivered corrections and RTK horizontal performance in less time.
Now is the ideal time for growers in our arable sector to be thinking about their yield data. But, we get it, things come up! One of the key challenges faced by our customers is finding the time to capture and use their data as things get busy leading up to harvest.
Let’s take a dive into some of the challenges our customers face this time of year and the small steps you can take now to make the most of your harvest this season.
Doing the doing
Many of our customers find themselves caught up in the myriad of tasks there are to do on-farm and don’t find the time to plan things out. All of a sudden, another season has come and gone, business as usual! We’re too busy doing the doing out in the field to get all the tech and planning sorted ahead of time.
Overwhelm
Precision Ag technology gives us a bunch of data to work with that can be overwhelming! Even if we capture the data correctly (which we encourage you to do – good data is key!), there’s so much to look at that it’s hard to know where to start and exactly what to pull out of it.
Finding value
That’s where the nitty-gritty comes in. Knowing exactly what data to look at and how that can turn into real value for your business is key to improving your profitability. Data is gold and the truth is, the better your data the more value you have to gain from it. But you have to know where to look.
Take the first step
Improving your business, and your bottom line, is all about taking the first step. Many farmers have already paid for the tech and just need to learn how to utilise it to get more value and improve profits! We recommend all farmers take the first step by utilising their technology this season to accurately record the first year of data on-farm. Once this is captured, you can begin to harness that information to extract value, improve efficiency, and reap greater profits from your farming practices.
Information is key.
To find out more about pre-harvest training and how to make the most of your yield mapping data, get in touch!
There is Trimble RTX satellite beam transition happening in New Zealand, which will require you to change your frequency and baud rate on your GNSS receiver before September 30, 2021.
This affects all GNSS receivers using CenterPoint RTX, FieldPoint RTX, RangePoint RTX, ViewPoint RTX and xFill correction services.
We apologize for the inconvenience caused by this change, however it allows us to continue to make enhancements to our RTX correction services. The new satellite beam, RTXPA, will be available on August 2nd, 2021 with 8 weeks of dual operational period. This means the new satellite beam will run 8 weeks in parallel with the current RTXAP satellite beam.
We encourage you to change your settings as soon as the new satellite is available using the instructions you can find at
What is changing?
Trimble RTX is being moved to a new satellite beam, RTXPA. You will no longer receive correction data from the current RTXAP satellite (1539.8325 Mhz, 600 baud) after September 30, 2021. Please change the frequency and baud rate on your GNSS receivers to use the new RTXPA satellite (1545.2725MHz, 1200baud) as soon as possible after the second of August.
When is it happening?
The new RTXPA satellite beam will be available starting on August 2nd, 2021. The old RTXAP satellite will stop broadcasting correction data on September 30, 2021.
How will I continue to receive GNSS corrections after this change?
You need to manually input the frequency and baud rate for the RTXPA satellite beam:
● Within the Trimble RTX settings on your GNSS receiver, change the RTX satellite by manually entering the frequency and baud rate for the RTXPA satellite, shown in the table below.
● Instructions are available at trimble.com/sat Satellite Beam Frequency (MHz) Baud Rate (bps) RTXPA 1545.2725 1200
For more information:
Get in touch with any of our Vantage NZ Trimble Hardware Specialists
Russell Van de Laak: 021 874 622
Wade Riley: 021 874 602
Cam Burmeister: 027 261 0708
Shane Blampied: 027 380 5332
Daniel Magill: 027 547 4747
Or you can go directly to the Trimble Customer Care team who is standing by to help, 24 hours a day, 7 days a week:
The 2021 Zimmatic Trailblazer Sustainable Irrigation Awards is now on and entries are open!
The Awards celebrate excellence and recognises New Zealand farmers demonstrating leadership in water management and environmental stewardship. The judges are looking for steps taken to ensure sustainable water use on farm and an obvious passion for protecting one of our most precious natural resources. They had an overwhelming response from farmers last year in terms of entry numbers. This year, they would like to invite you to lend your support and help us build on this success.
Please help us spread the word through your own networks and encourage farmers in your area to enter themselves or nominate someone else that they think is deserving. You may even have friends or neighbours who are worthy of being nominated. If so, please put their name forward! This year’s competition is open to New Zealand farmers who irrigate more than 25ha.
The online entry and nomination process is simple, just visit the Awards website irrigationtrailblazer.com and click the red links on the home page to access the appropriate form. You can find out what impressed our judges last year in our two part leading submission summary; click here for Part 1 and Part 2. We hope this provides you with some insight into why the leading entrants from the 2020 awards caught the judging panels eye!
Servicing your soil moisture probe sites gives your telemetry the best chance at performing well – and is a service we offer! As seen below, these are common problems our technicians come across in the field; pugging, chewed cables, and blocked rain gauges. Whether you use your data to guide your decisions on farm or you simply rely on your data for auditing and compliance purposes, these issues won’t be helping your case.
Our soil moisture site service includes a rain gauge calibration, because over time being exposed to the elements, things can change. If you feel that your rain gauge data is out of line, we are more than happy to calibrate it for you. We also check over the quality of data your probe is creating to ensure that it is settled and as accurate as possible. Whilst on site, an assessment of the surroundings is taken to see whether moving the probe would be beneficial, that solar panels are facing north, no pugging has occurred, and that rain gauges aren’t blocked. An annual soil moisture report is then crafted up by one of the technicians for you to keep and reflect over for the coming months. Any further advice required will be also given.
An Electro-magnetic (EM) Survey is one of the key layers required on the precision farming journey. Precise location and understanding of soil types is a key piece of information in driving decisions around water use and nutrient placement. Not only can an EM Survey be used to reduce water inputs it can form the basis of other decisions related to plant health, production and nutrient uptake.
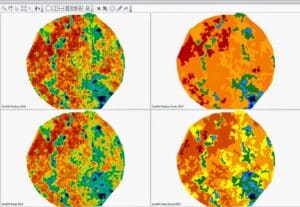
An EM Survey measures two soil profiles, one measuring the variability in the top 0-50 cm of soil and the other looking at variability in the top 0-125cm of your soil profile. Following a survey customers receive a comprehensive report outlining the findings in each survey depth. Depending on the variability arising from the survey, different management zones can be created to suit the final application. These zoned maps can then be used as the basis for variable rate irrigation (VRI) variable rate fertiliser, variable rate seeding and much more.
Figure 1. Top left is a shallow EM map and to the right of it a zoned map of that layer. Below is the same but for the deeper EM (0-125cm).
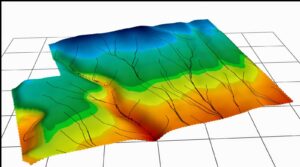
As well as collecting detailed soil information, and EM Survey also collected detailed topographic information. This data set in its own right is very useful and builds a deeper understanding of the role surface topographic changes play in water movement across the area. Coupled with the soil variability data itself this data can identify key areas for management changes to make a large difference to paddock, pasture, crop and nutrient management.
Figure 2. Specialist precision ag software generates water movement models based on the topography data.
Another simple but effective use for EM Survey data is to use it for placing soil moisture probes based on soil variability and slope to find your optimum site within each management zone. These sites can also be used as ground-truthing sites for water-holding capacity. From these your EM map can then be converted into a water-holding capacity map
EM Surveying information can be used for a myriad of uses, not all of which we’ve covered in this article. As soil is the basis for farming the land we work with, it makes sense to ‘dig a bit deeper’ and start our precision ag journey with a deeper understanding of our soils.
New to the Vantage portfolio is water-holding capacity assessments. These work alongide our EM Survey to aid in making more informed decisions. You can find out more about water-holding capacity assessments and what they add here.
To understand how EM Surveying can be used in your business, reach out to the Vantage NZ team to learn more.
From time to time we get the query: “my soil moisture sensor hasn’t responded to recent irrigation events, there must be something wrong with the sensor”.
While it is easy and natural to blame the sensor, the reason is often found in the field. There are physical reasons why a sensor may not register an event and the problem could be caused by a combination of these.
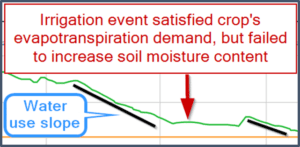
Figure 1. An irrigation event causing a neutral change in soil moisture content.
Canopy interception
The crop’s canopy will intercept some of the rainfall and/or irrigation water. Obviously, this will vary greatly from crop to crop and throughout the growth stages. It stands to reason that a mature crop of maize will intercept more water than freshly grazed pasture.
Much of the intercepted water will evaporate, but while it is sitting on the leaf it will cool the leaf and reduce the plant’s evapotranspiration rates.
Some of the intercepted water will trickle down the stem and enter the soil at the plant base, but not in sufficient quantities to register at the first sensor depth.
This scenario will look like a neutral response on the soil moisture graph (Figure 1). The irrigation event has not caused a soil moisture increase, but it did satisfy the plant’s evapotranspiration demand, so there is no water use for the day.
Application depth –less than daily water use and/or less than 0-100mm deficit
This tends to be a problem under pivots and fixed sprinklers. Daily irrigation of 4-5mm may not be enough to result in a significant change in soil moisture content at the first sensor depth (100mm). Firstly, some of the water will be intercepted. Secondly, the application may be less than the deficit present above the first sensor site, the water will infiltrate into the soil but may be absorbed in the top 50mm of soil. In this case the response to the irrigation event at the first sensor (100mm) will, at best be a “flattening” of the trace; soil moisture will remain at its current level.
Bypass-flow -dry soils and soil type
Bypass-flow occurs when water passes through the macro pores (or gaps between soil particles) and is not absorbed by the soil particles. Bypass-flow and soil type are linked; coarse texture soils have more macro pores, increasing the potential for bypass-flow.
Bypass-flow and soil moisture content are also linked. As a soil dries it can undergo slight structural changes which may result in increased macro-porosity. The effect of drying varies with soil type. A fine textured soil with higher clay content will tend to shrink; typically, at the surface of the soil resulting in opening of cracks in the soil. In coarser textured soils cracks will not develop, but individual aggregates will contract, increasing the soil’s macro-porosity.
Water passing through the macro pores, or cracks, may not be registered by the soil moisture sensor; firstly, because the slurry used when the sensor is installed will have fewer macro pores than the rest of the field; and secondly, because the water fails to ‘linger’ long enough to infiltrate and re-wet the dry slurry the sensor is installed in.
Lack of sensor response due to a dry soil profile is most common in crops where the readily available water is greatest, e.g. wheat or carrot seed.
It is less common in frequently irrigated crops where the readily available water is small, e.g. ryegrass pasture, vegetable seeds and peas.
Key management strategies
It is useful to think of the soil moisture sensor as any other tool on the farm; it needs to be maintained to work properly. The sensor responses will be more reliable if slurry is not allowed to dry out. Soil moisture sensor management strategies include:
Adjust application depth to overcome crop interception.
Adjust application depth to be greater than daily water use.
Adjust application depth to ensure irrigation water will replace the target deficit.
If the slurry has dried and sensor response is lost, this is resolved through long duration rainfall, rather than re-installation of sensors. Usually all sensors regain perfect contact with the soil over the winter months.
At Vantage NZ we are proud to supply you with high quality AquaCheck soil moisture sensors and neutron services and to back it up with a high standard of service and expertise. Give us a call to discuss your soil moisture monitoring requirements and get set up in good time for the 2021-22 season.
Article written by: Jane Robb, Customer Support Specialist
Yield maps are one of the most powerful – and under-utlised – tools for decision making on an arable farm.
Yield maps are a record of how your crops performed under that season’s constraints, taking into account nutrient variability, soil moisture variability, application variability and much more. The final result is that often yield varies more than we care to admit and we quicky remember the good parts of a paddock and forget the poor parts.
Farmers making the most of their yield data insights annually are fine tuning base fertiliser applications through the use of variable rate, identifying zones of productivity potential or risk to monitor throughout the season and really enhancing not only their final yield across a paddock but also their profitability. Profit mapping is uniquely available to arable farmers and it proves a fast way to identify areas of a farm or crop rotation that need improvement. It also allows critical, justified decision making to take place based on the dollars and cents.
As the harvest season commences, it’s important to ensure that you’re capturing all your yield information, even if you have no intention of acting on the information this season. ultiple years’ worth of data is far more useful than one year of data.
To find out more on how to ensure your yield data is being captured correctly, to save data for your future use for you or to book in your yield mapping requirements for this season, give the expert team at Vantage NZ a call on 0800 482 682 or visit https://www.vantage-nz.com/yielddata
Article published in: Guardian Farming, February 2021