Soil Testing in Mid Canterbury – Pye Group Case Study

Pye Group is an agricultural company owned by Leighton and Michelle Pye, operating 11 dairy farms and over 4,800 hectares of land across Temuka, Rangitata, Hinds, Rakaia, and Fairlie.

Their primary activities include dairy grazing for their own cows, substantial cropping (grains, wheat, barley, milling wheat, specialty grasses, and vegetables), and supplying turf grass to the US for golf courses. They also supply 25,000 tonnes of carrots and 15,000–18,000 tonnes of potatoes to McCains annually.

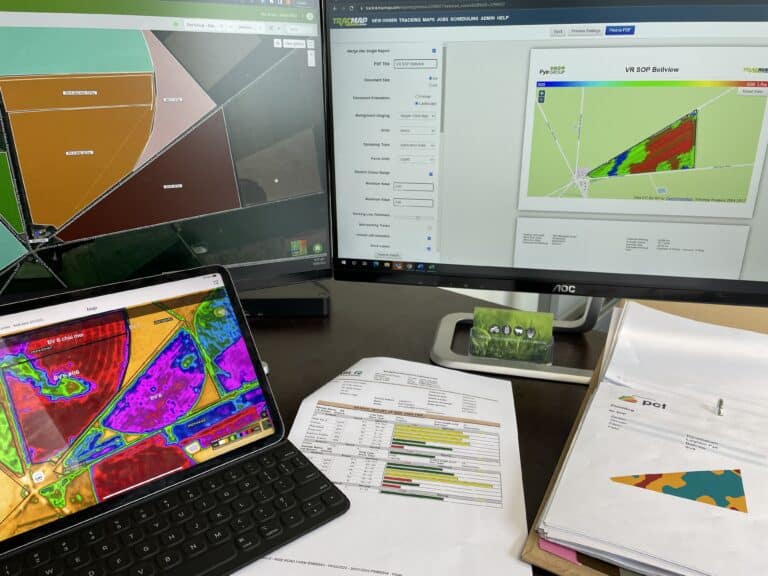
Working with Vantage NZ since 2012, the company has invested in soil testing, moisture probes, EM soil surveying, and yield mapping. This has helped them better understand soil quality and exactly what nutrients each piece of their land needs.

One of the biggest challenges for Pye Group is ensuring a balanced nutrient supply for optimal growth on their cropping farms and being able to provide proof of placement. Prior to working with Vantage, the group used blanket application of fertiliser, applying a standardised amount across the whole farm. 

The solution:

With Precision Nutrient Management, they are now able to apply variable rates of products such as Lime, Potassium Chloride, Superphosphate and Magnesium Oxide based on maps that outline the exact quantity each part of the paddock needs. They have found that in some paddocks, three quarters will receive no nutrients, and one corner will need four different rates. If they had blanket applied, they would have overloaded the majority of the soil.

Outcomes:

This approach has significantly increased their yield and allowed Pye Group to optimise fertiliser use and reduce waste.  The precision approach to fertilising has had numerous benefits for the Pye Group, including cost savings on transportation, time, effort, labour, fuel, and equipment wear and tear. Additionally, having guidance on equipment has resulted in savings of up to 10% on overlap. This translates into close to $50,000 in savings per percent of overlap in nutrients.

Soil testing has also been used on their dairy farms to ensure that there is no nutrient overload at the front of the paddock where the gate is located. The cows always return to the dairy shed through the gate, transferring all the concentrated nutrients from the back of the paddock to the front in their manure and urine. With this information, The Pye Group has implemented exclusion zones in the first 10% of the paddock, as nutrients are not required there.

Tony Gould, Operations and Transport Manager, has been implementing PNM strategies with the help of Vantage NZ and Ravensdown and has invested a lot of time and effort into data capture and quality.

“You can’t argue with data and can make long-term, data-driven plans that relate to real information; it’s not estimated. People either overestimate or underestimate, but when you have the data, you can actually see what you have done and what the result has been. Unless you get soil testing done and use variable rate application, you just can’t make targeted decisions,” said Tony.

Precision Agriculture Data on the computer at Pye Group

Precision agriculture has been a game-changer for the Pye Group, and they believe that it is a solution that can be implemented on any scale. You just need to start. 

To find out how precision ag could help you to reduce costs and maximise profits, contact Vantage NZ on 0800 482 682 or vantage-nz.com.

Pinpoint exactly why your yield was different this year! 

Your farm’s hardware and software systems capture some extremely valuable data points about your paddocks during harvest. Do you know how to extract value from that data to turn it into informed decisions for next season? That’s where yield mapping comes in. 

Your yield data is the final measure of your season’s work. By turning that data into yield maps, you gain a good picture of where your yield is coming from and the profitability of each piece of your land. This allows you to make data-informed decisions about how to manage your farm.  

Yield mapping has been around since the 1990s, when GPS data was first coupled with different sensors on the harvester to be able to measure and map parameters such as crop yield, moisture, speed, elevation, and much more. Most headers and combine harvesters are already recording this data, so why not use it? 

It all takes quality data. 

Precision agriculture technologies are available to help you figure out why a field produced a high or low yield and what you can do differently next season. Is it your soil moisture? Are you lacking a vital nutrient? Is your nutrient load too high in some areas? You can’t just guess this stuff; it takes quality data.  

To make the most of your yield maps, we suggest an EM Soil Survey which will give you priceless information on the variable soil properties across your land. Knowing your soil properties, such as texture, salinity, and cation exchange capacity, will help you plan how to best use and manage each piece of your land. This only needs to be done once and continues to provide value for years to come. 

We also recommend Precision Nutrient Management (PNM), which allows you to apply the right amount of nutrients only to the area that requires them, as determined by more intensive soil sampling.  

Once you’ve got these in place, you can use your yield maps to look back at your high and low spots of yield. By comparing nutrient levels and soil types, you are able to work out exactly what may be lacking and what you need to change heading into the next year. 

So, you have the data; what next? 

Even if we capture the data correctly (which we encourage you to do—good data is key!), there’s so much to look at that it’s difficult to know where to start and exactly what to pull out of it. When you create yield maps with Vantage NZ, one of our reps will work with you to make sure you have all the right data and strategies in place, before creating the yield maps for you and showing you how to use them. They’ll work with you to figure out the reasons for variation in yield across your farm. 

Using yield mapping, we can dig right into your data to determine why your crop performed the way it did and design a strategy for land preparation and the planting season. It’s all well and good to record the data, but now is the time to use it! 

We use your data to produce profit maps and nutrient off-take maps from within each field. We can analyse how different field management strategies affect yield, apply fertiliser more accurately according to the nutrients removed, create prescription maps for variable rate application, budget your seed, and have improved decision-making and budgeting for future years. 

With the systems you already have in place, you can already go back and view your data, but you can’t compare it to the data you have from EM Soil Surveys and PNM. Our team at Vantage can download your data either through Trimble Ag Software or into our own software programmes to clean it up and edit it, then turn your raw data into zone maps to visually see what is happening across your paddocks. These maps can then be overlayed against your soil type (EM) pH and nutrient maps (PNM) where we can start to figure out what might be the cause for areas of low and/or high Production? 

Yield mapping is not an overnight process. 

Many of our customers find themselves caught up in the myriad of tasks there are to do on-farm and don’t find the time to plan things out. All of a sudden, another season has come and gone, business as usual! We’re too busy doing the work out in the field to get all the tech and planning sorted ahead of time. 

Data is gold, and the truth is, the better your data, the more value you have to gain from it. Developing high-quality data takes years, so the sooner you start, the sooner you can extract value, improve efficiency, and increase profits. Having years of data is invaluable, as you can see year after year what has worked and what needs changing. 

In the long-term, you can work toward evening out the yield capability across your paddock by applying nutrients exactly where they’re needed and increase yield in low-performing areas or plant according to soil types for better ROI. 

Need help making sense of your data and turning it into data-driven insights for next season? Talk to our friendly team at Vantage NZ. We have Precision Ag Specialists around the country that can take your data and turn it into valuable insights.

Find out more at vantage-nz.com/yield-mapping

The latest Trimble Displays are here

The GFX-1060 and GFX-1260 have landed in New Zealand and are now in stock. Maximise your efficiency and ROI with these easy-to-use displays, offering:

 Simplicity – easy to install, use, and transfer between vehicles
– Reliability – rugged construction to stand the test of time
– Flexibility – high compatibility to work with your existing equipment
– Scalability – the technology can easily adapt as your business changes and grows

With faster processing, greater memory and more storage capacity, these robust displays make handling even the most complex farm operations easy.

The GFX-1260™ display is Trimble Agriculture’s newest flagship 12-inch (30.5 cm) Android-based display, the ideal choice for controlling and executing all in-field work through the Precision-IQ™ field application interface.

The GFX-1060™ display is Trimble Agriculture’s latest 10-inch (25.6 cm) Android-based display, a great option for controlling and executing all in-field work, also equipped with the Precision-IQ™ interface.

Compare their specifications using the table below.

GFX-1060 Display
GFX-1260 Display
10 inch (12 cm) high-definition, color touchscreen display
12 inch (30.5 cm) high-definition, color touchscreen display
Android-based operating system
Precision-IQ firmware
32 GB storage, 4 GB RAM
Optional ISOBUS task controller and universal terminal
Control up to 4 input channels and 48 sections
Control up to 6 input channels and 48 sections
Connection for two USBs, 1 BRR port, 3 CAN ports and support for 2 external cameras, plus Bluetooth® and Wi-Fi connectivity

Customer story

Hear what a Trimble customer has to say about working with the new GFX displays.

Find out more or download datasheets at vantage-nz.com/displays.

Better spray coverage, less drift and waste with MagrowTec

The cost of chemicals is rising and environmental regulations are tightening, so wastage is just not an option. with conventional sprayers a significant proportion of the spray does not reach its target crop, which causes run-off, drift, and wasted inputs.

This is why the team at Vantage New Zealand is eager to install MagrowTec on as many sprayers as possible.

MagrowTec is a magnetic assist conditioning technology that improves spray coverage by more than 20 percent while reducing drift by up to 70 percent. This allows farmers to use inputs more efficiently, significantly reducing their costs and environmental impact.

MagrowTec won the 2021 Sustainable Scaleup Award in the Thrive Bayer Sustainability Challenge for its commitment to more sustainable food production. This award recognises businesses that are implementing systems that reduce the environmental impact of crop protection and improve water management.

Spray quality can help maximise profits on farm. When it comes to chemical application, size does matter. The single most crucial factor in spray performance is droplet size.

The droplets in conventional sprayers are often either too small or too large. If they are too small, they float longer and can evaporate or drift away from the target. Too large, and they hit the plant at a higher speed, so they bounce, shatter, and run-off. This reduces retention on the leaf and the chemical’s performance.

MagrowTec creates more of the optimum-sized spray droplets during spraying. These droplets are neither too big nor too small and they ensure more of the spray is applied to the weeds, crop canopy, buds, flowers, stalk, fruit, vegetable or soil.

It produces spray droplets that have sufficient momentum to overcome drift and get down to the plant canopy but are also small enough to stay on the plant surface upon impact. This can have a significant impact on your bottom line.

The MagrowTec system is a hardware system that is fitted onto the sprayer to condition the fluid as it passes from the tank to the nozzle. With only two main components, it can be attached to any new or existing sprayer and works with multiple nozzles.

There are no moving parts, and it doesn’t need a power supply, so maintenance is minimal.

MagrowTec in NZ

Studies have been conducted on MagrowTec on farms across the globe. These include potato farms in the Netherlands, canola and wheat crops in Canada, and seed vegetable crops in Australia.

Recently a water-sensitive paper study was conducted in New Zealand to assess the spray coverage of a sprayer fitted with the MagrowTec system compared to a conventional sprayer in two canopy positions critical to the agronomy of late blight (Phytophthora infestans) and powdery mildew (Solanum tuberosum) in potatoes.

The trial looked at the coverage in the upper and lower canopy. Depending on the type of crop being sprayed, the lower canopy can be particularly challenging to target with the delivery of plant protection products.

MagrowTec’s system showed the highest increase in coverage within the lower crop canopy compared to the conventional option. It also achieved the highest level of spray coverage in the upper canopy.

Overall, the MagrowTec system achieved spray coverage of 30.3 percent compared to the conventional option, which achieved 22.6 percent. Within the lower canopy, the system achieved a mean coverage of 34 percent, an improvement in spray coverage versus the conventional option, which achieved 23 percent.

As the portfolio of chemical products available is reduced year on year, it is more important than ever to ensure farmers and contractors use the most efficient spray practises. You can rest assured that MagrowTec will help you do more with less.

To find out how you can start your journey with MagrowTec, visit our webpage

Three steps for a successful harvest season

With harvest just around the corner, it’s important to have one eye on the future planning your success. In an arable farming system, this is a key time of year to maximise capturing every last grain that contributes to yield and annual performance. It’s what you strive all year for, one decision after another – to grow the best crops and maximise your performance and profitability. A crucial component of good planning is capturing your yield data so that you can track and optimise your farm’s performance. As always, there’s plenty going on in farming and with Christmas and New Year tied up with the time most arable farmers start, it’s easy to feel rushed and drop some of the important aspects of harvest setup and success.


Here are three key steps to ensure harvest success and maximise your yield data.


  1. Before harvest – make sure your combine is serviced, your displays/screens are working (and tested), your wiring looms are installed in your combine (if you’re planning on swapping GPS from one machine to another) and that last season’s yield data on your data card, memory stick or display is downloaded and saved (preferably with a backup) safely for future use. This is also an important time to set up your display with the correct paddock and crop names so that when it comes time to pull that header into the paddock, it’s good to go.
  2. During harvest – when you pull into the first paddock on day one, try to take your time. Make sure everything is set up and working correctly (GPS, moisture meters, flow meters) and that you perform some yield calibrations to get the data recorded as accurately as possible. There’s no need to get too hung up on this if final paddock weights will be available for post-processing yield data, but it’s important to make sure you will end up with accurate data to give you good insights on your yield performance. After the first paddock, we also suggest downloading and checking that the data is recording and mapping correctly.
  3. After harvest – Engage with your precision ag consultants to get the data processed as fast as possible. This ensures you maximise your decision-making time and can use your data to guide decisions for the upcoming season – eg variable rate nutrient replacement and/or variable rate seeding. This data is gold and the more years of yield data put together, the more you identify opportunities to tweak your management practices to optimise profitability across all areas of your paddock or farm.

Vantage New Zealand are your local precision ag experts, with reps located throughout New Zealand. To find out more about how we can help you maximise your yield data, call 0800 482 682 or visit https://www.vantage-nz.com/yield-mapping/


Season and multi-season discounts available when you book before 31st December, 2022.

How are you using your data?

Now is the ideal time for growers in our arable sector to be thinking about their yield data. But, we get it, things come up! One of the key challenges faced by our customers is finding the time to capture and use their data as things get busy leading up to harvest.  

Let’s take a dive into some of the challenges our customers face this time of year and the small steps you can take now to make the most of your harvest this season.

Doing the doing

Many of our customers find themselves caught up in the myriad of tasks there are to do on-farm and don’t find the time to plan things out. All of a sudden, another season has come and gone, business as usual! We’re too busy doing the doing out in the field to get all the tech and planning sorted ahead of time.

Overwhelm

Precision Ag technology gives us a bunch of data to work with that can be overwhelming! Even if we capture the data correctly (which we encourage you to do – good data is key!), there’s so much to look at that it’s hard to know where to start and exactly what to pull out of it.

Finding value

That’s where the nitty-gritty comes in. Knowing exactly what data to look at and how that can turn into real value for your business is key to improving your profitability. Data is gold and the truth is, the better your data the more value you have to gain from it. But you have to know where to look.

Take the first step

Improving your business, and your bottom line, is all about taking the first step. Many farmers have already paid for the tech and just need to learn how to utilise it to get more value and improve profits! We recommend all farmers take the first step by utilising their technology this season to accurately record the first year of data on-farm. Once this is captured, you can begin to harness that information to extract value, improve efficiency, and reap greater profits from your farming practices.

Information is key.

To find out more about pre-harvest training and how to make the most of your yield mapping data, get in touch!

Trimble RTX Beam Transition

Attention

There is Trimble RTX satellite beam transition happening in New Zealand, which will require you to change your frequency and baud rate on your GNSS receiver before September 30, 2021. 

This affects all GNSS receivers using CenterPoint RTX, FieldPoint RTX, RangePoint RTX, ViewPoint RTX and xFill correction services.

We apologize for the inconvenience caused by this change, however it allows us to continue to make enhancements to our RTX correction services. The new satellite beam, RTXPA, will be available on August 2nd, 2021 with 8 weeks of dual operational period. This means the new satellite beam will run 8 weeks in parallel with the current RTXAP satellite beam.

We encourage you to change your settings as soon as the new satellite is available using the instructions you can find at

What is changing? 
Trimble RTX is being moved to a new satellite beam, RTXPA. You will no longer receive correction data from the current RTXAP satellite (1539.8325 Mhz, 600 baud) after September 30, 2021. Please change the frequency and baud rate on your GNSS receivers to use the new RTXPA satellite (1545.2725MHz, 1200baud) as soon as possible after the second of August.

When is it happening?
The new RTXPA satellite beam will be available starting on August 2nd, 2021. The old RTXAP satellite will stop broadcasting correction data on September 30, 2021.

How will I continue to receive GNSS corrections after this change?

You need to manually input the frequency and baud rate for the RTXPA satellite beam:
● Within the Trimble RTX settings on your GNSS receiver, change the RTX satellite by manually entering the frequency and baud rate for the RTXPA satellite, shown in the table below.
● Instructions are available at trimble.com/sat Satellite Beam Frequency (MHz) Baud Rate (bps) RTXPA 1545.2725 1200

For more information:
Get in touch with any of our Vantage NZ Trimble Hardware Specialists

Russell Van de Laak: 021 874 622
Wade Riley: 021 874 602
Cam Burmeister: 027 261 0708
Shane Blampied: 027 380 5332
Daniel Magill: 027 547 4747

Or you can go directly to the Trimble Customer Care team who is standing by to help, 24 hours a day, 7 days a week:

New Zealand:
Phone +64 3 354 9195
Toll Free 0800 888 864
Email nz_corrections@trimble.com 

My soil moisture sensor hasn’t responded as I expected? Why?

From time to time we get the query: “my soil moisture sensor hasn’t responded to recent irrigation events, there must be something wrong with the sensor”.

While it is easy and natural to blame the sensor, the reason is often found in the field. There are physical reasons why a sensor may not register an event and the problem could be caused by a combination of these.

Figure 1. An irrigation event causing a neutral change in soil moisture content.

Canopy interception

The crop’s canopy will intercept some of the rainfall and/or irrigation water. Obviously, this will vary greatly from crop to crop and throughout the growth stages. It stands to reason that a mature crop of maize will intercept more water than freshly grazed pasture.

Much of the intercepted water will evaporate, but while it is sitting on the leaf it will cool the leaf and reduce the plant’s evapotranspiration rates.

Some of the intercepted water will trickle down the stem and enter the soil at the plant base, but not in sufficient quantities to register at the first sensor depth.

This scenario will look like a neutral response on the soil moisture graph (Figure 1). The irrigation event has not caused a soil moisture increase, but it did satisfy the plant’s evapotranspiration demand, so there is no water use for the day.

Application depth –less than daily water use and/or less than 0-100mm deficit

This tends to be a problem under pivots and fixed sprinklers. Daily irrigation of 4-5mm may not be enough to result in a significant change in soil moisture content at the first sensor depth (100mm). Firstly, some of the water will be intercepted. Secondly, the application may be less than the deficit present above the first sensor site, the water will infiltrate into the soil but may be absorbed in the top 50mm of soil.  In this case the response to the irrigation event at the first sensor (100mm) will, at best be a “flattening” of the trace; soil moisture will remain at its current level.

Bypass-flow -dry soils and soil type

Bypass-flow occurs when water passes through the macro pores (or gaps between soil particles) and is not absorbed by the soil particles. Bypass-flow and soil type are linked; coarse texture soils have more macro pores, increasing the potential for bypass-flow.

Bypass-flow and soil moisture content are also linked. As a soil dries it can undergo slight structural changes which may result in increased macro-porosity. The effect of drying varies with soil type. A fine textured soil with higher clay content will tend to shrink; typically, at the surface of the soil resulting in opening of cracks in the soil. In coarser textured soils cracks will not develop, but individual aggregates will contract, increasing the soil’s macro-porosity.

Water passing through the macro pores, or cracks, may not be registered by the soil moisture sensor; firstly, because the slurry used when the sensor is installed will have fewer macro pores than the rest of the field; and secondly, because the water fails to ‘linger’ long enough to infiltrate and re-wet the dry slurry the sensor is installed in.

Lack of sensor response due to a dry soil profile is most common in crops where the readily available water is greatest, e.g. wheat or carrot seed.

It is less common in frequently irrigated crops where the readily available water is small, e.g. ryegrass pasture, vegetable seeds and peas.

Key management strategies

It is useful to think of the soil moisture sensor as any other tool on the farm; it needs to be maintained to work properly. The sensor responses will be more reliable if slurry is not allowed to dry out. Soil moisture sensor management strategies include:

Adjust application depth to overcome crop interception.

Adjust application depth to be greater than daily water use.

Adjust application depth to ensure irrigation water will replace the target deficit.

If the slurry has dried and sensor response is lost, this is resolved through long duration rainfall, rather than re-installation of sensors. Usually all sensors regain perfect contact with the soil over the winter months.

At Vantage NZ we are proud to supply you with high quality AquaCheck soil moisture sensors and neutron services and to back it up with a high standard of service and expertise. Give us a call to discuss your soil moisture monitoring requirements and get set up in good time for the 2021-22 season. 

Article written by: Jane Robb, Customer Support Specialist